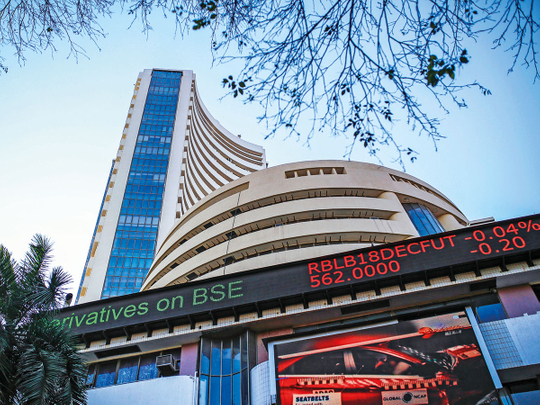
Sensex, Nifty may open higher on Monday. This week, right on top of the agenda is India’s gross domestic product (GDP) data for the June-ended quarter. The purchasing managers’ indices (PMI) for August are also due and will serve as the latest report card for Indian businesses’ recovery progress. Elsewhere, the PMI data for the euro area and China will also be watched.
Notwithstanding the pandemic severe shock, India’s macroeconomy is more healthy and ready for faster growth, eminent economist Ashima Goyal said on Sunday, observing that recovery from both the first and second waves was faster than expected points towards inherent strengths of the economy. Many benchmark stocks also hit all-time highs and it’s the Bajaj Group that has made the maximum inroads.
On Friday, US stock markets closed with gains after US Federal Reserve Chairman, Jerome Powell said that tapering bond purchases could begin by the year-end. NASDAQ zoomed 1.23% while S&P 500 gained 0.88% and Dow Jones jumped 0.69%. Among Asian peers, Shanghai Composite, Nikkei 225, TOPIX, KOSPI, and KOSDAQ were trading in the green.
Hang Seng was down with losses. Levels to watch out: “The texture of the chart suggests that the 10 days SMA or 16550 would be the sacrosanct level for the breakout,” said Shrikant Chouhan, Executive Vice President, Equity Technical Research, Kotak Securities. “If the index crosses the level, the uptrend could continue up to 16825-16950 levels. On the flip side, dismissal of 16550 may trigger temporary weakness till 16375-16300 levels,” he added.
Foreign Institutional Investors have been net sellers of domestic stocks for 9 consecutive trading sessions. On Friday, FIIs pulled out Rs 778 crore from Dalal Street. Domestic Institutional Investors have, however, continued to pump in money in regular intervals. On Friday, DIIs injected domestic markets with Rs 1,646 crore. For the upcoming weekly F&O expiry, the maximum Call OI is placed at 16,700, followed by a 17,000 strike price. On the other hand, Put OI is most at 16,600, followed by 16,500 strikes.
Bank Nifty on the other hand has formed a bullish candle finally. Shadows on either side indicating indecisiveness amongst participants regarding the direction. For the past three months, the index is consolidating within 36300-34000 levels indicating short term sideways trend. Hence any either side breakout will indicate further direction.
The chart pattern suggests that if Bank Nifty crosses and sustains above 35800 levels it would witness buying which would lead the index towards 36000-36500 levels. However, if the index breaks below the 35000 levels it would witness selling which would take the index towards 34500-34000 levels. At the moment though, enjoy the record highs of the market as everything seems to be going really well for the markets. Nothing wrong as of now but a state of caution has been advised as markets have entered uncharted territory.
Expect the IT, Capital Goods, Chemicals, FMCG and Cement sectors to do well in the near term. Stocks like Mindtree, Wipro, Tech Mahindra, Bata India, L&T, Siemens, ICICI Bank, Bajaj Finance, Reliance Industries Ltd (RIL), Navin Fluorine can do well in near term is what most the experts have opined.


